Dashboard Tour
Ruptura v7 ships a Svelte 4 SPA at http://<node-ip>:31469. Below is a full walkthrough grounded in the live lab running at
Workload lifecycle phases
Every workload passes through three phases. Understanding them is key to reading the UI correctly.
Phase 1 — Calibrating
status: "calibrating" calibration_progress: 32 calibration_eta_minutes: 16
When Ruptura first sees a workload it needs roughly 30 minutes of history to build adaptive baselines (Welford online statistics per metric). During calibration:
- The card shows a
CALbadge (gray/muted) instead of a health ring color - A "Building baseline…" progress indicator and ETA appear on the card
- FusedR is computed but rupture alerts are suppressed — a single noisy startup spike will not page anyone
- All 10 signals are visible and updating every 15 s
Opening the detail drawer shows a prominent blue banner: "Calibrating baseline — 32% complete · ETA 16m". The Signals tab renders all 10 KPI tiles but marks baselines as undefined until the window is complete.
This is the correct behavior. Ruptura is learning what "normal" looks like for this specific workload before it starts predicting.
Phase 2 — Active (alerting enabled)
status: "active" rupture_detection: "active"
Once calibration completes, the full prediction stack activates:
- Health ring border turns green / yellow / red based on FusedR
⚠ Critical in ~12mwarning appears when the HealthScore forecast is heading toward critical- Ruptures fire when FusedR ≥ 1.5 (Warning), 3.0 (Critical), or 5.0 (Emergency)
- Pattern-match warnings appear if the current KPI vector matches a prior rupture (cosine similarity ≥ 0.85)
Phase 3 — Rupture
fused_rupture_index: 21.97 state: "critical" health_score: 16.63
A confirmed rupture means FusedR crossed a threshold and stayed there. The card turns red, a rupture event is logged in the Events tab, and the action engine evaluates whether to suggest or automatically execute a remediation. The live lab currently shows payment-api in this state.
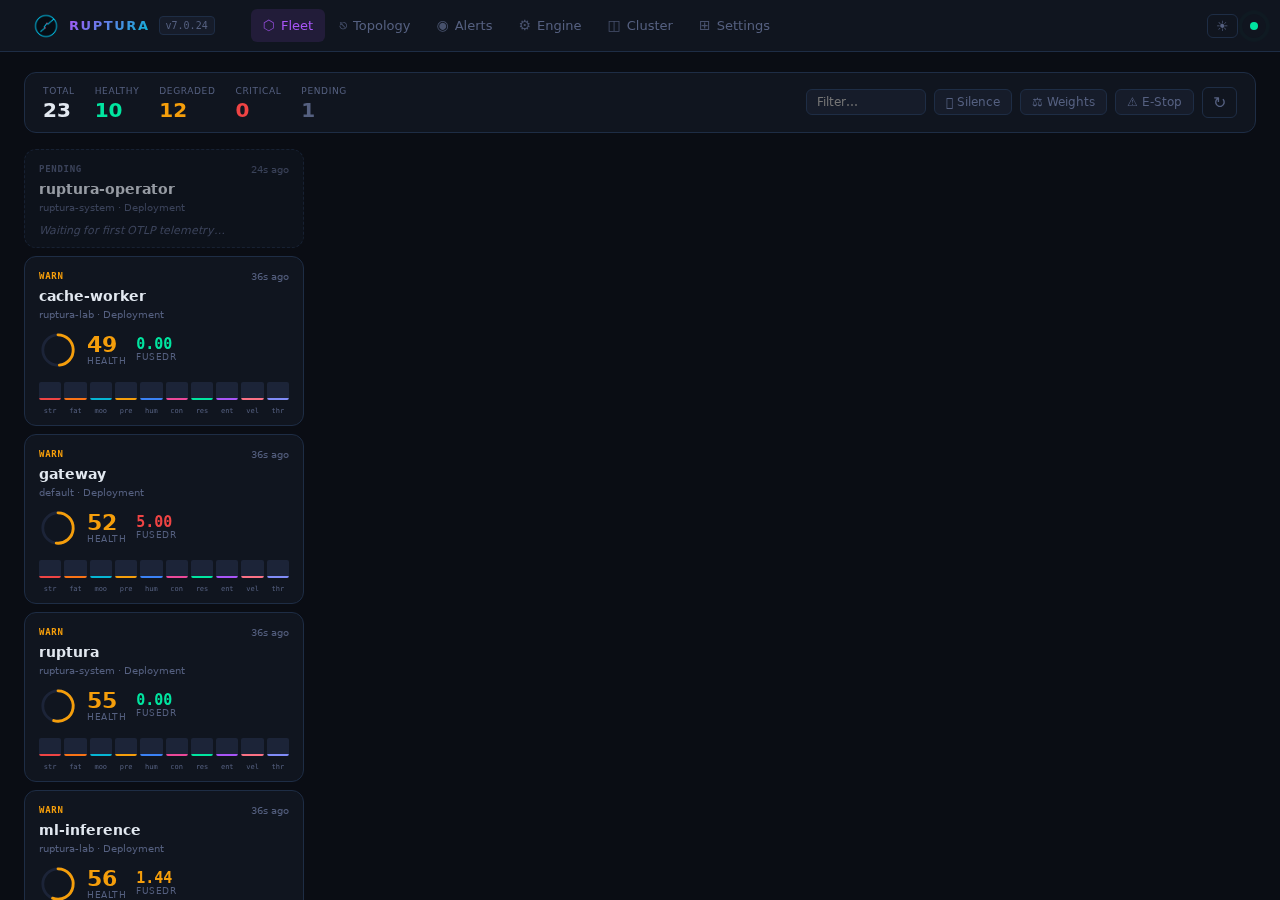
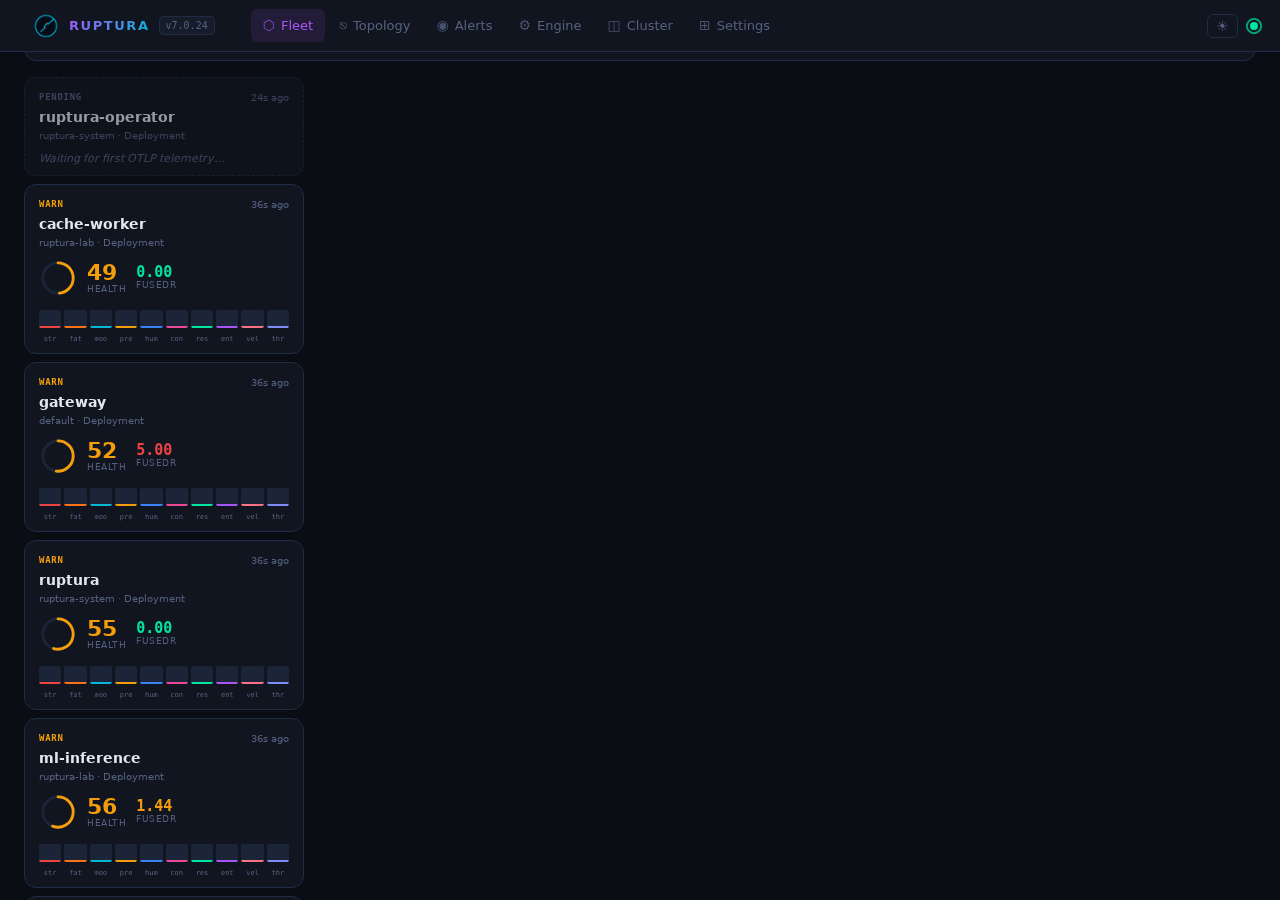
Fleet view
The Fleet page is your top-level situational awareness view. Each card shows:
| Element | What it means |
|---|---|
| Health ring | Current HealthScore (0–100). Color: green ≥ 70, yellow 40–70, red < 40 |
| 10 signal mini-bars | One bar per KPI, height = normalized value. Red bar = critical signal |
| FusedR badge | Composite rupture score. Gray = calibrating, green < 1.5, yellow 1.5–3.0, orange 3.0–5.0, red ≥ 5.0 |
| Calibration progress | Gray progress bar + ETA during Phase 1 |
⚠ Critical in ~Xm |
HealthScore forecast heading toward critical — appears when critical_eta_minutes is set |
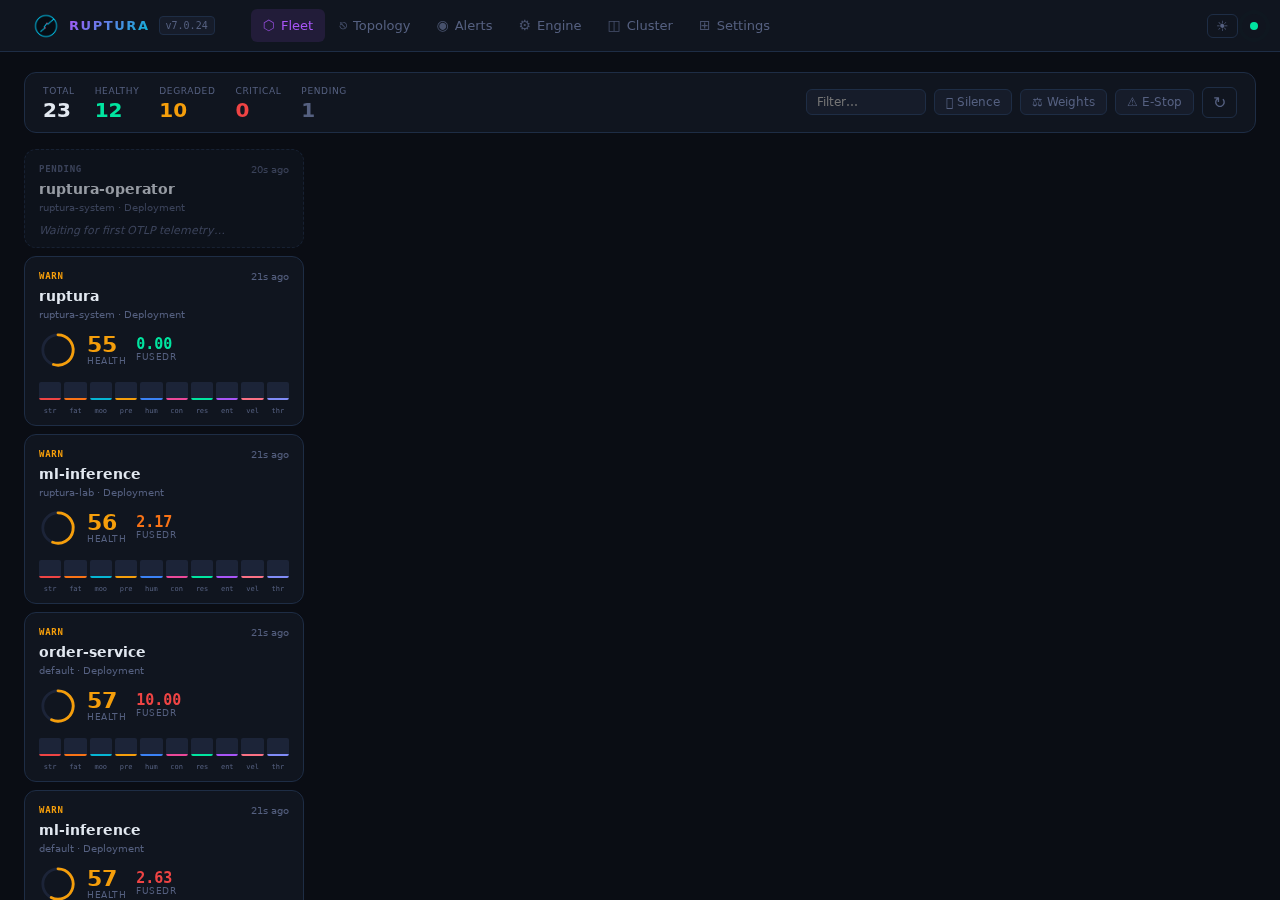
Live lab fleet state (from the running engine):
payment-api     critical   HealthScore  16.6   FusedR  21.97   stress=panic  fatigue=burnout  contagion=pandemic
order-service   critical   HealthScore  18.2   FusedR   9.18   stress=panic  fatigue=burnout
gateway         critical   HealthScore  26.7   FusedR 349.94   stress=panic  fatigue=burnout
cache-worker    critical   HealthScore  28.0   FusedR 2842     stress=panic  fatigue=burnout
ml-inference    critical   HealthScore  17.8   FusedR 131.85   calibrating
The SSE live rupture counter in the header updates in real time without polling.
Workload detail — Signals tab
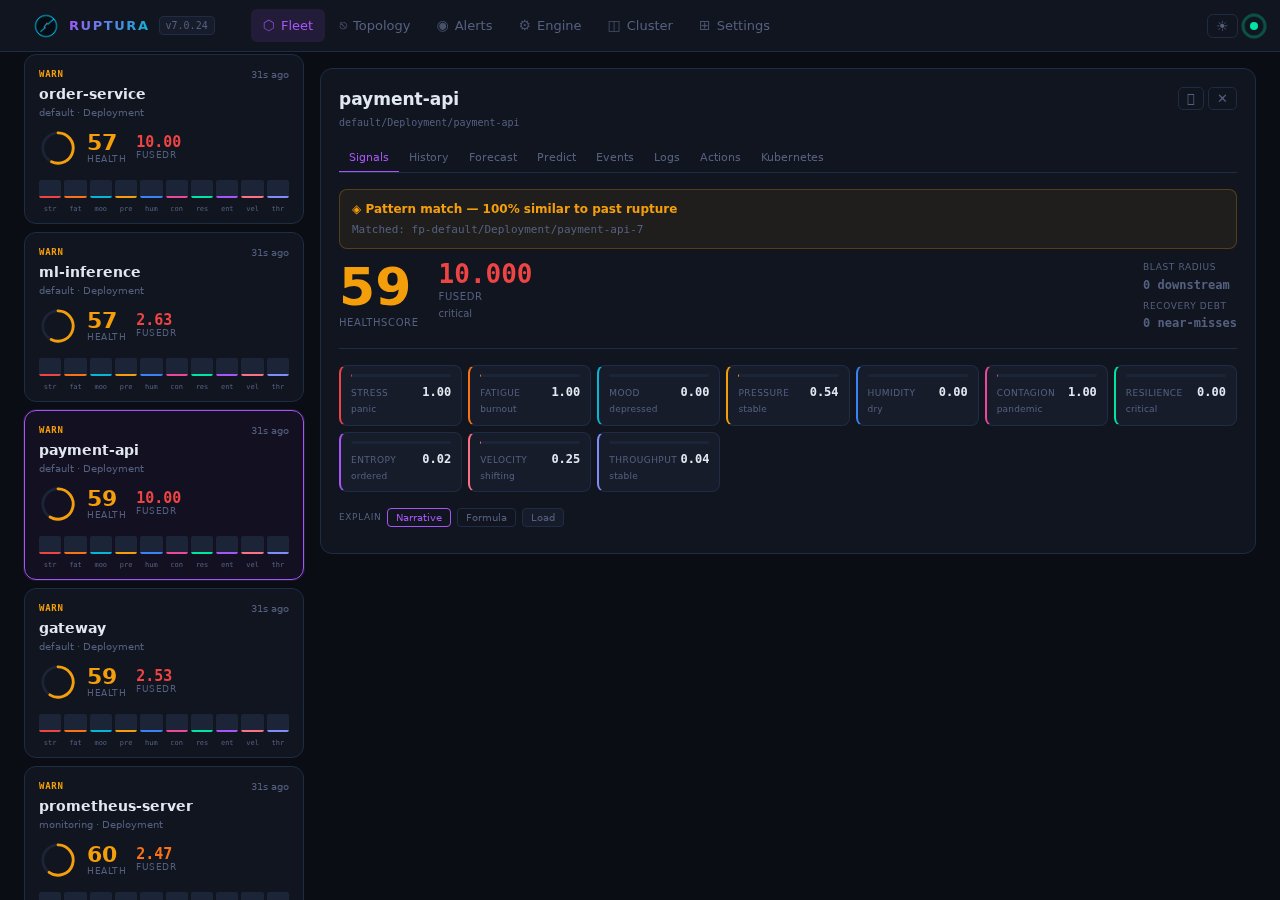
Click any card to open the detail drawer. The Signals tab shows all 10 KPI gauges with their current value and state name.
Signal states — full vocabulary
Each signal has a set of named states that go beyond simple ok/warning/critical:
Stress (CPU + latency burst)
| Value | State | Meaning |
|-------|-------|---------|
| 0.0–0.3 | calm | Normal load |
| 0.3–0.6 | nervous | Elevated but manageable |
| 0.6–0.85 | stressed | Sustained high load |
| 0.85–1.0 | panic | Maximum stress — CPU pegged, latency spiking |
Fatigue (long-term wear)
| Value | State | Meaning |
|-------|-------|---------|
| 0.0–0.3 | fresh | No accumulated load history |
| 0.3–0.6 | tired | Some sustained load in history |
| 0.6–0.85 | exhausted | Extended high load period |
| 0.85–1.0 | burnout | At maximum accumulated deviation — recovery needed |
Mood (log sentiment)
| Value | State | Meaning |
|-------|-------|---------|
| 0.7–1.0 | happy | Mostly info/debug logs |
| 0.4–0.7 | neutral | Mixed log levels |
| 0.1–0.4 | unhappy | Warn-heavy log stream |
| 0.0–0.1 | depressed | Error/warn dominant — application distressed |
Contagion (cross-service propagation)
| Value | State | Meaning |
|-------|-------|---------|
| 0.0–0.2 | contained | No error spreading |
| 0.2–0.5 | spreading | Error propagating to 1–2 upstreams |
| 0.5–0.8 | epidemic | Multiple upstream services affected |
| 0.8–1.0 | pandemic | Fleet-wide cascade — critical |
Resilience (recovery capacity)
| Value | State | Meaning |
|-------|-------|---------|
| 0.7–1.0 | strong | Recovers quickly from spikes |
| 0.4–0.7 | recovering | Moderate recovery speed |
| 0.1–0.4 | fragile | Slow to recover |
| 0.0–0.1 | critical | No recovery buffer — next spike will cascade |
Pressure (memory + disk saturation): comfortable → rising → heavy → critical
Humidity (forecast variance): dry (predictable) → humid → stormy (chaotic, high variance)
Entropy (signal disorder): ordered → mixed → chaotic
Velocity (request rate acceleration): steady → accelerating → surging
Throughput (data volume): low → normal → high → flood
Live example: payment-api in rupture
From the running lab:
stress:     1.000  panic       CPU pegged from error retry storms
fatigue:    1.000  burnout     72+ minutes of sustained load
mood:       0.000  depressed   error rate at maximum
pressure:   0.432  improving   memory pressure easing slightly
contagion:  1.000  pandemic    error wave spreading to dependents
resilience: 0.000  critical    no recovery buffer remaining
humidity:   0.000  dry         behavior is predictably bad
entropy:    0.023  ordered     deterministic failure, not random
velocity:   0.013  steady      rate of change is stable (plateau)
health:    18.52   critical

FusedR: 21.97  →  Emergency tier
The combination of burnout + pandemic + critical resilience is the signature of a cascade rupture that is self-sustaining.
Live example: inventory-service (degraded, building)
stress:     0.182  calm        low CPU usage
fatigue:    0.000  fresh       recent deployment
pressure:   rising             memory slowly climbing (leak pattern)
resilience: strong             not yet stressed enough to lose buffer
health:    67.94   degraded

FusedR: 2.056  →  Warning tier — trending toward Critical
This is the early-warning phase. FusedR is 2.0 and rising — Ruptura will alert before this crosses 3.0.
History tab
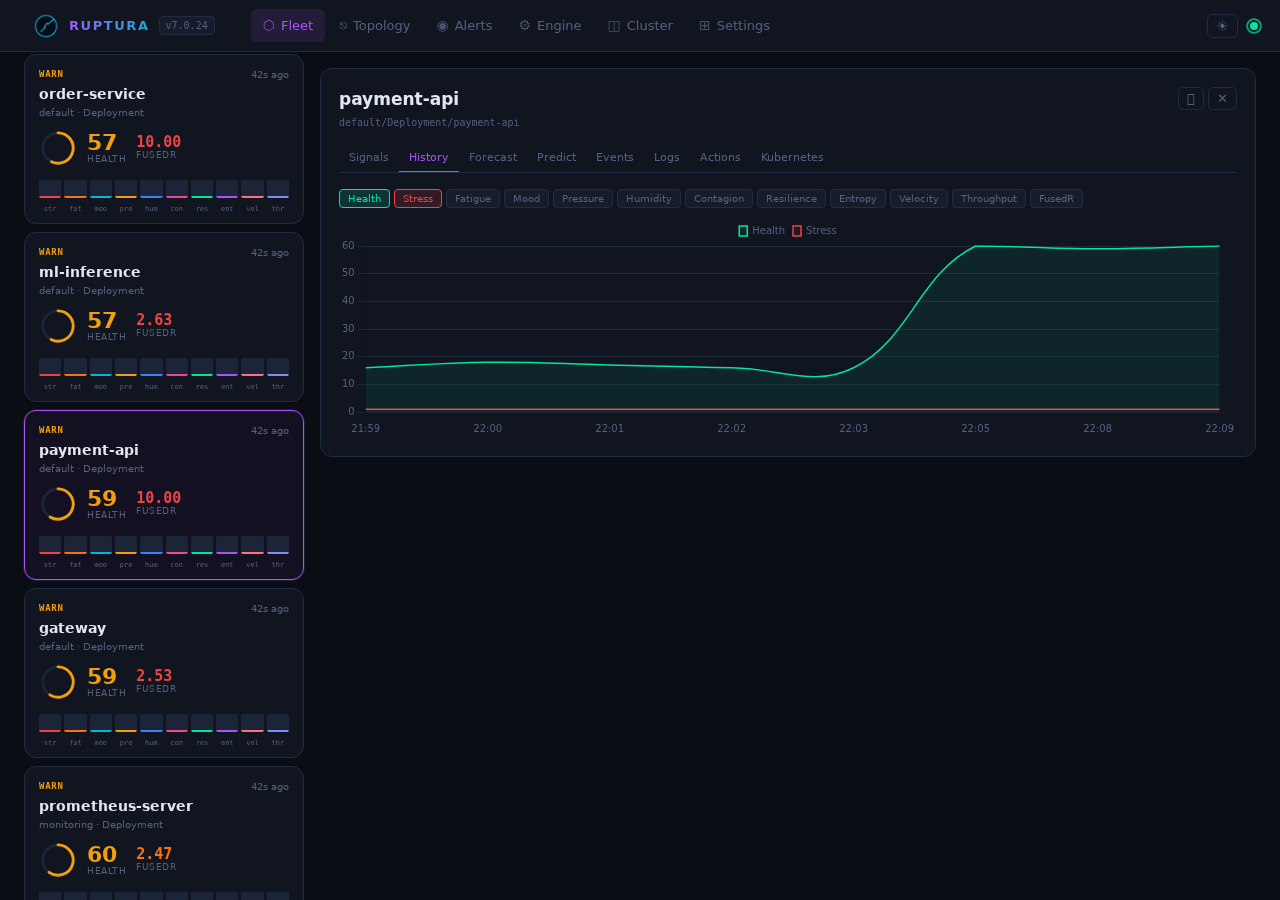
Time-series chart for any signal over the workload's stored history. Toggle signal chips to overlay multiple signals. Useful for:
- Slow-burn detection: flat stress but rising fatigue over hours
- Cascade timing: see the exact tick where contagion jumped
- Recovery confirmation: resilience recovering after an action was applied
Forecast tab
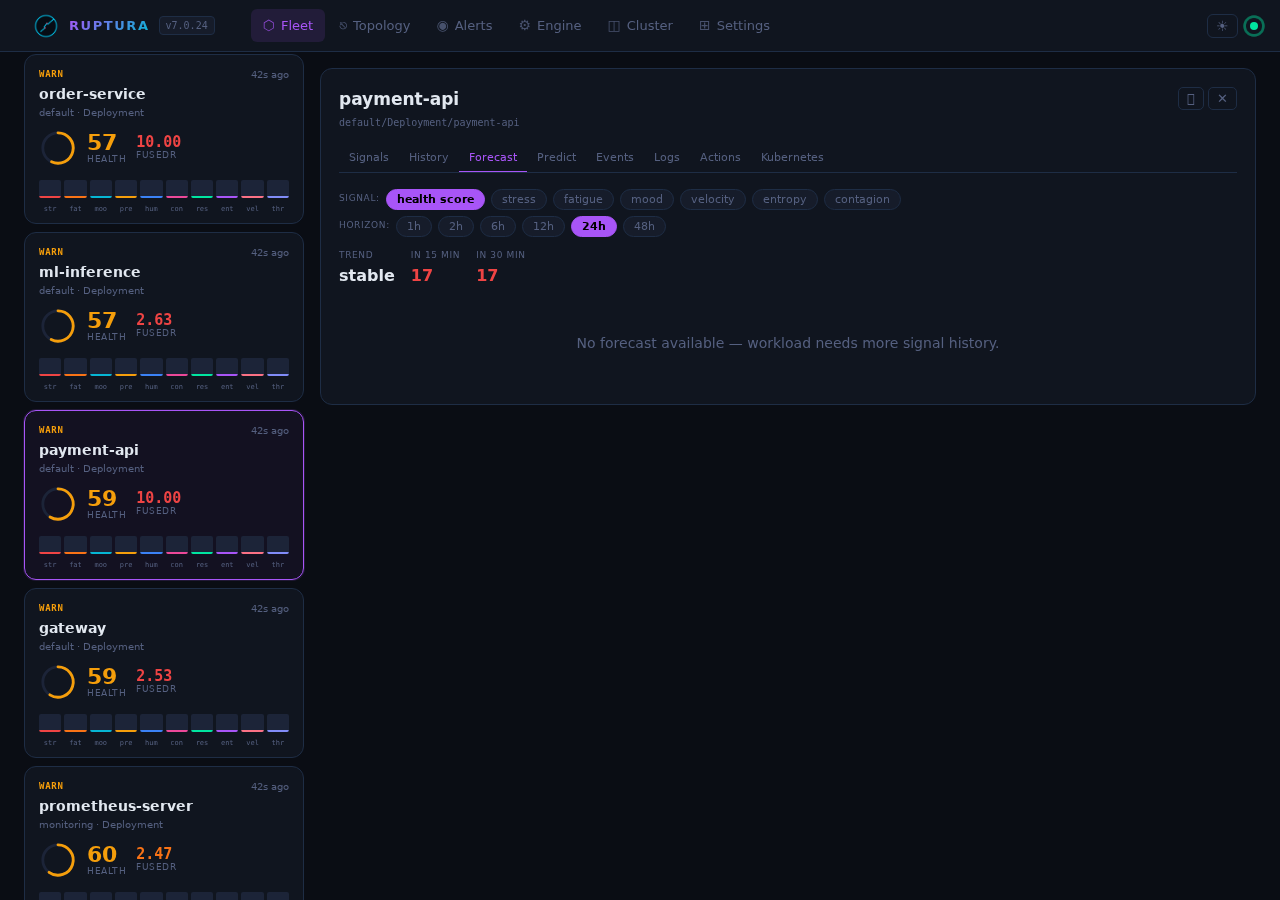
Projects HealthScore +15 and +30 minutes using the 5-model ensemble (CA-ILR, ARIMA, Holt-Winters, MAD, EWMA). When the trajectory is heading toward critical, critical_eta_minutes is populated and ⚠ Critical in ~Xm appears on the card.
The ensemble weights are re-computed every 60 s based on each model's mean absolute error over the past hour. No manual tuning needed — the models that predicted well get more vote.
Predictions tab
Per-metric model outputs: each of the 5 models shows its current prediction and its current weight. Useful for debugging why a particular workload's FusedR is behaving unexpectedly.
Events tab
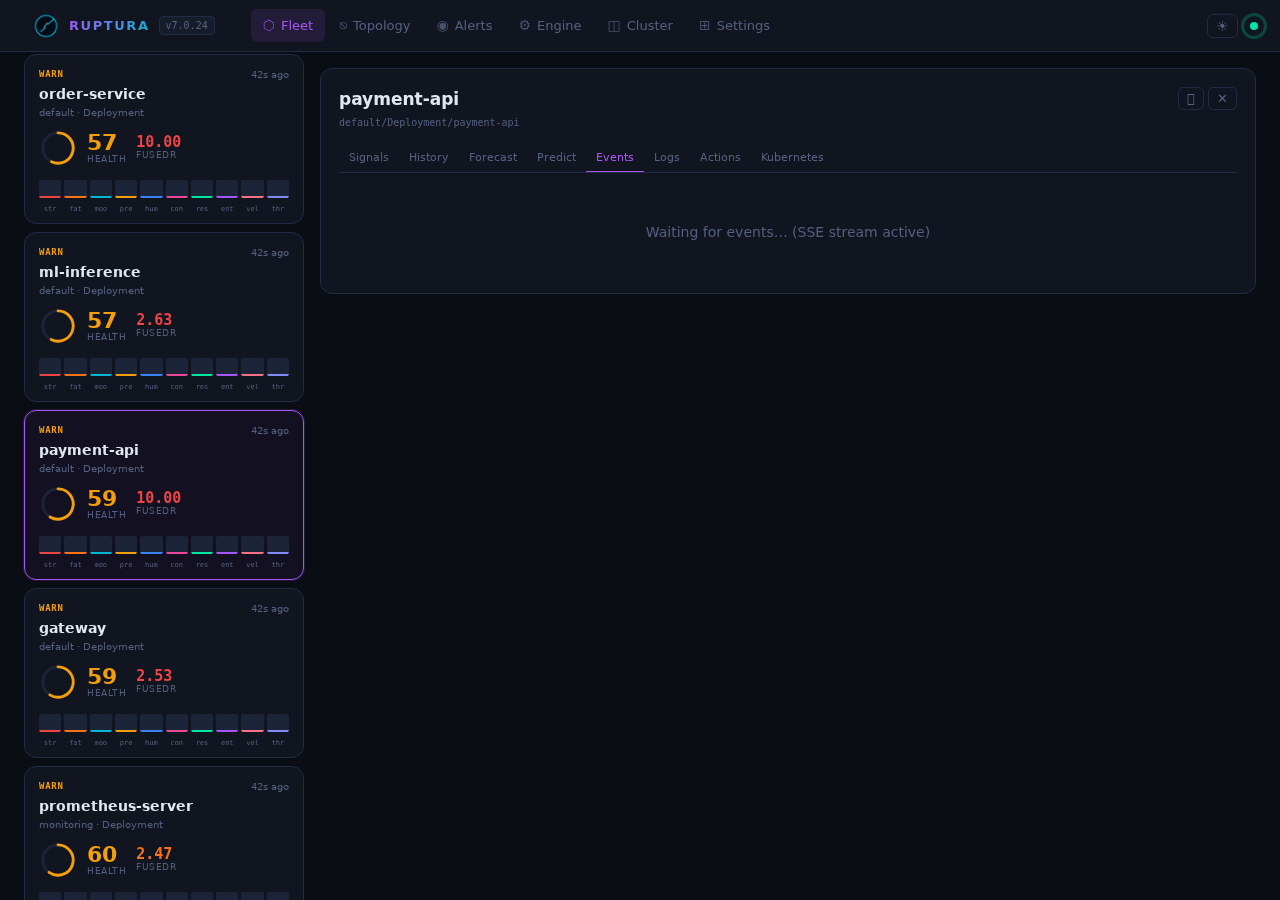
Live SSE rupture/recovery log. Each entry includes: - Timestamp - FusedR at trigger time - Which threshold was crossed (Warning / Critical / Emergency) - Which signals were primary drivers
Actions tab
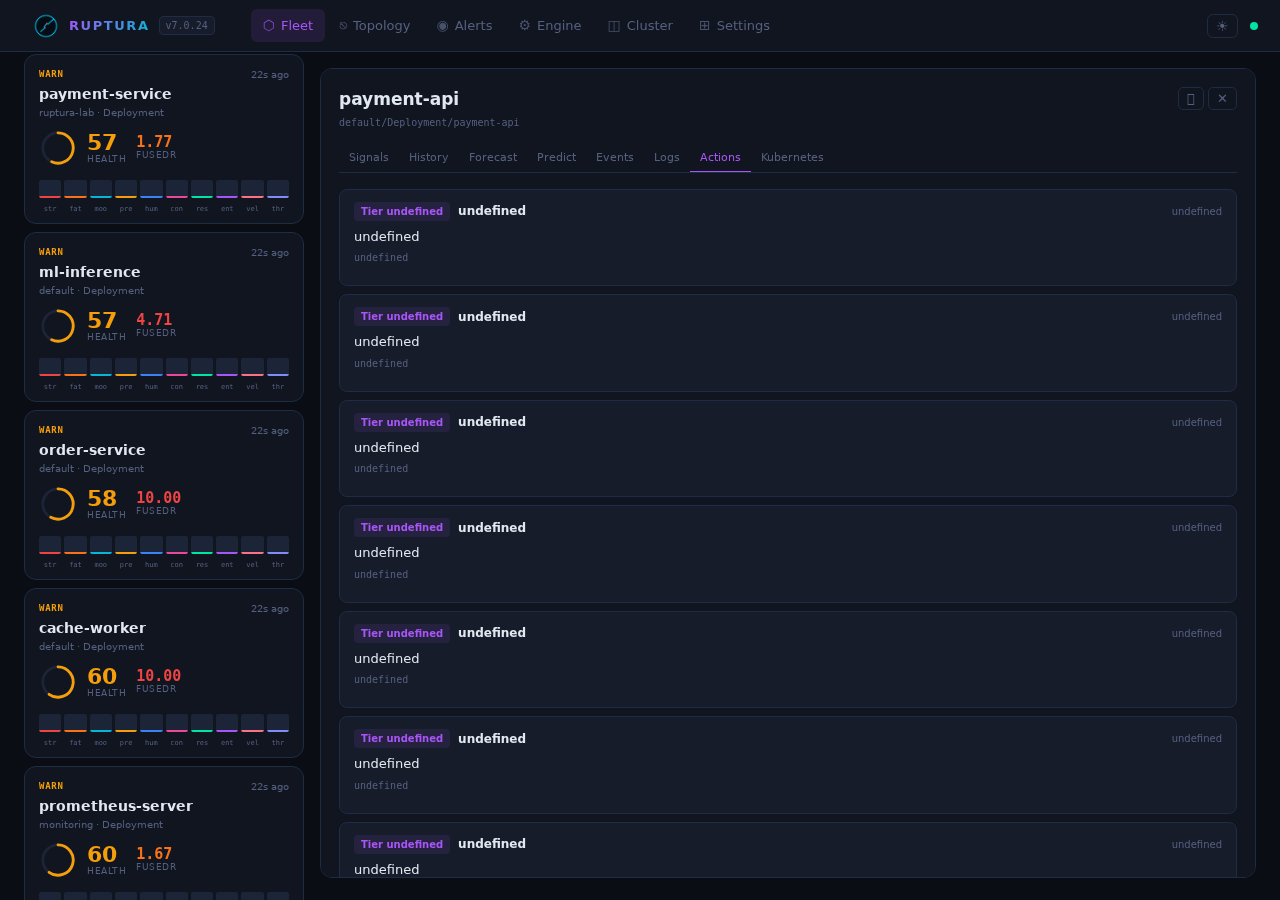
Tier-2 actions (FusedR 3.0–5.0) appear here for human approval. Each action shows: - Recommended action (scale / restart / cordon) - Confidence score - Approve / Reject buttons
Tier-1 actions (FusedR ≥ 5.0) execute automatically if the autopilot edition is enabled.
Emergency stop: A dedicated button sends POST /api/v2/actions/emergency-stop — immediately halts all automated Tier-1 execution.
Topology view
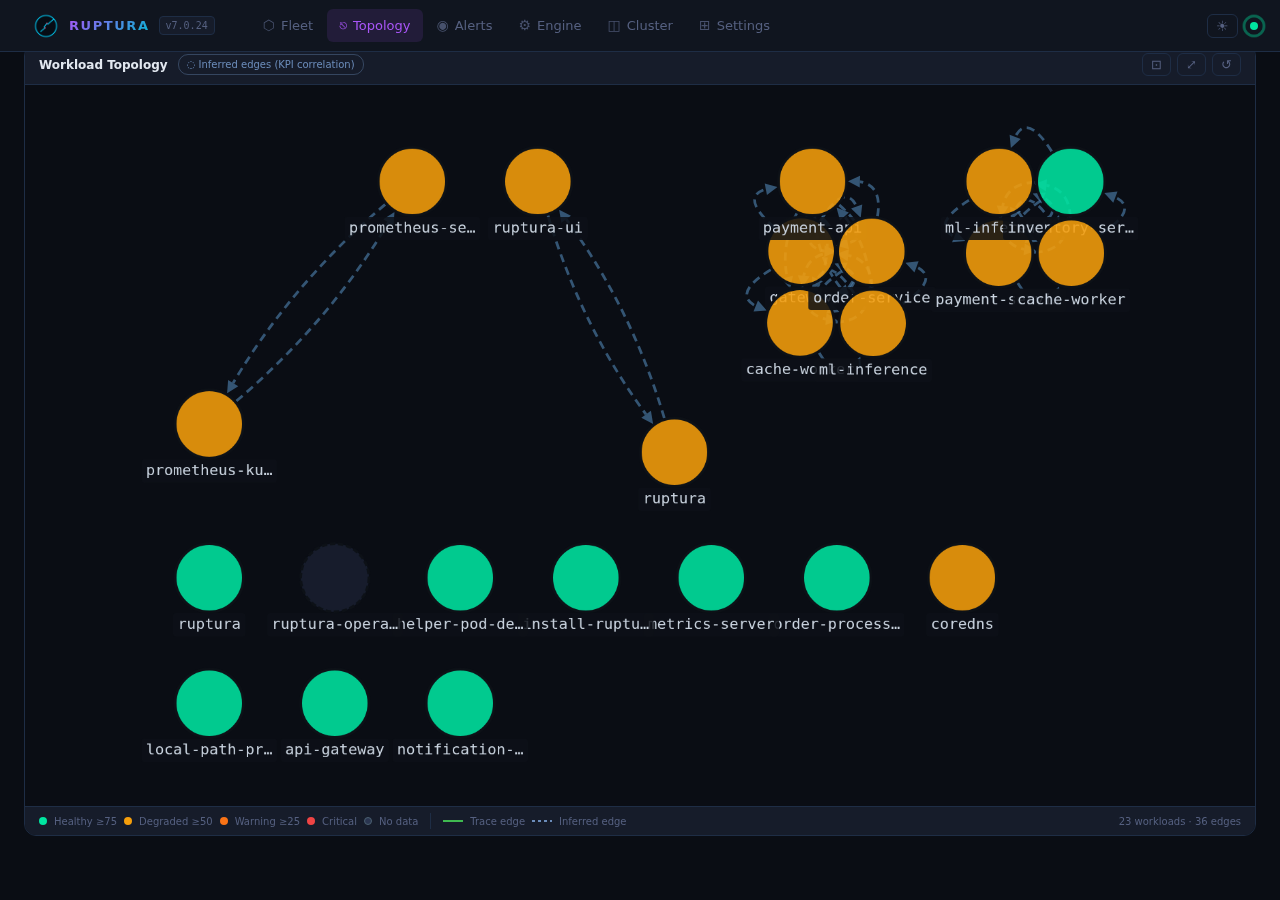
Service dependency graph from OTLP trace spans. Only populated when OTLP traces are flowing.
- Click a node → health bar + current FusedR
- Click an edge → call rate, error rate, P99 latency for that service pair
The graph builds automatically from span data — no configuration needed.
Engine view
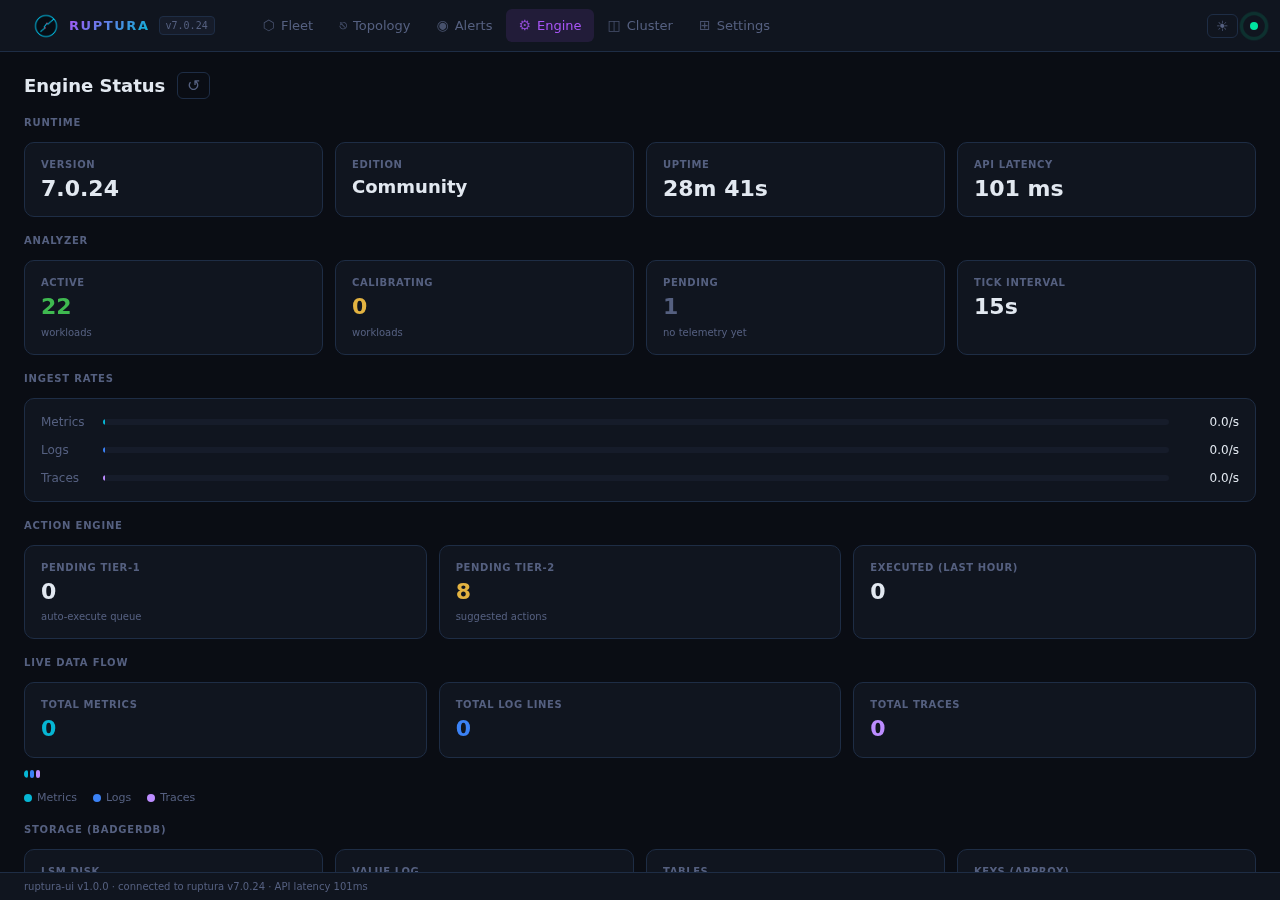
Ruptura runtime diagnostics:
| Metric | What it shows |
|---|---|
| Tracked workloads | Total workloads with active signal history |
| Analyzer state | Last tick time, interval |
| Ingest rates | metrics/s, logs/s, traces/s, parse errors |
| BadgerDB | Storage size, GC stats, TTL compaction |
Live engine health check:
{
  "status": "online",
  "version": "7.0.23",
  "edition": "community",
  "uptime_seconds": 644,
  "rupture_detection": "active",
  "message": "Running — building signal history"
}
Cluster / Nodes view
K8s node health from the k8smetrics poller: CPU, memory, disk pressure per node. Useful for spotting when a node's resource pressure is causing pod evictions (the root cause of the most common scheduling failures).
Alerts view

Live alert feed from the anomaly detectors. Each alert shows:
host:     ruptura-lab/Deployment/notification-worker
metric:   fatigue
value:    6.0   (expected: 0.5)
score:    7.42  (MAD anomaly score)
method:   mad
severity: warning
Two independent detectors must agree before an alert becomes critical. This eliminates most false positives.
Settings
Datasources tab
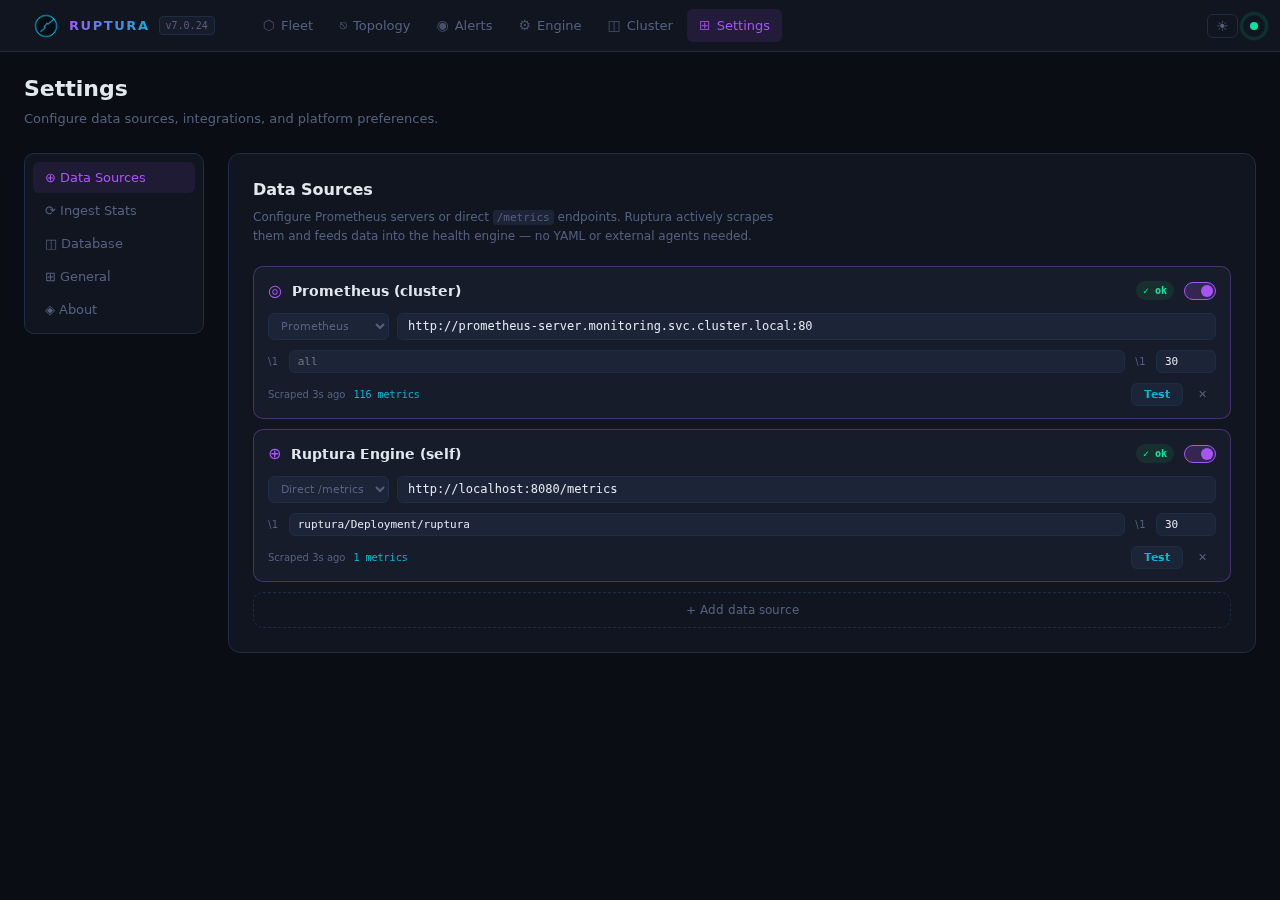
Currently active in the lab:
prometheus-cluster   Prometheus (cluster)   scraping every 30s   59 metrics/tick
self-ruptura-metrics Ruptura Engine (self)  scraping every 30s    1 metric/tick
Register a Prometheus or OTLP datasource. OTLP datasources bypass SSRF validation (the URL is Ruptura's own push endpoint). Click Test to TCP-dial the endpoint.
Ingest Stats tab
Live totals: metrics received, logs received, traces received, parse errors, active workloads.
Database tab
Per-signal-type retention (days), plus purge controls: - Purge by type — delete all data for a signal type - Purge by date — delete data older than a given date - Purge all — full data reset (confirmation required)
Quick install
helm install ruptura oci://ghcr.io/benfradjselim/charts/ruptura \
  --namespace ruptura-system \
  --create-namespace \
  --set apiKey=$(openssl rand -hex 32) \
  --set ui.enabled=true \
  --set ui.service.type=NodePort

# Dashboard:   http://<node-ip>:31469/
# Engine API:  http://<node-ip>:31468/api/v2/health
# OTLP ingest: http://<node-ip>:31470/api/v2/write
Inject synthetic workloads immediately:
python3 scripts/simulate.py
# 5 workloads, 5 s interval:
#   gateway        — stable/healthy
#   order-service  — slow-burn CPU stress (45→90% over 10 min)
#   payment-api    — error bursts every 2 min (8→43% error rate)
#   cache-worker   — traffic spikes every 3 min (up to 2800 req/s)
#   ml-inference   — noisy/calibrating new workload
All workloads will calibrate within ~30 minutes and full rupture detection activates automatically.